

Widgets
A widget is a scripted visualization component that renders HTML, charts, or data grids — placed on dashboards and displayed on the home page.
Widgets are the building blocks that make dashboards useful. A dashboard defines placement and layout; a widget defines what gets rendered in each tile.
Choose HTML, Chart, or Grid
Section titled “Choose HTML, Chart, or Grid”- HTML Use for custom layouts, text summaries, KPI cards, or lightweight presentational blocks.
- Chart Use when the script should return an ECharts configuration, such as a line chart, bar chart, or pie chart.
- Grid Use for row-based tabular output.
Choose the renderer based on the final output shape you want, not only on the data source you start with.
Create a widget
Section titled “Create a widget”- Navigate to Widgets (accessible from the dashboards section).
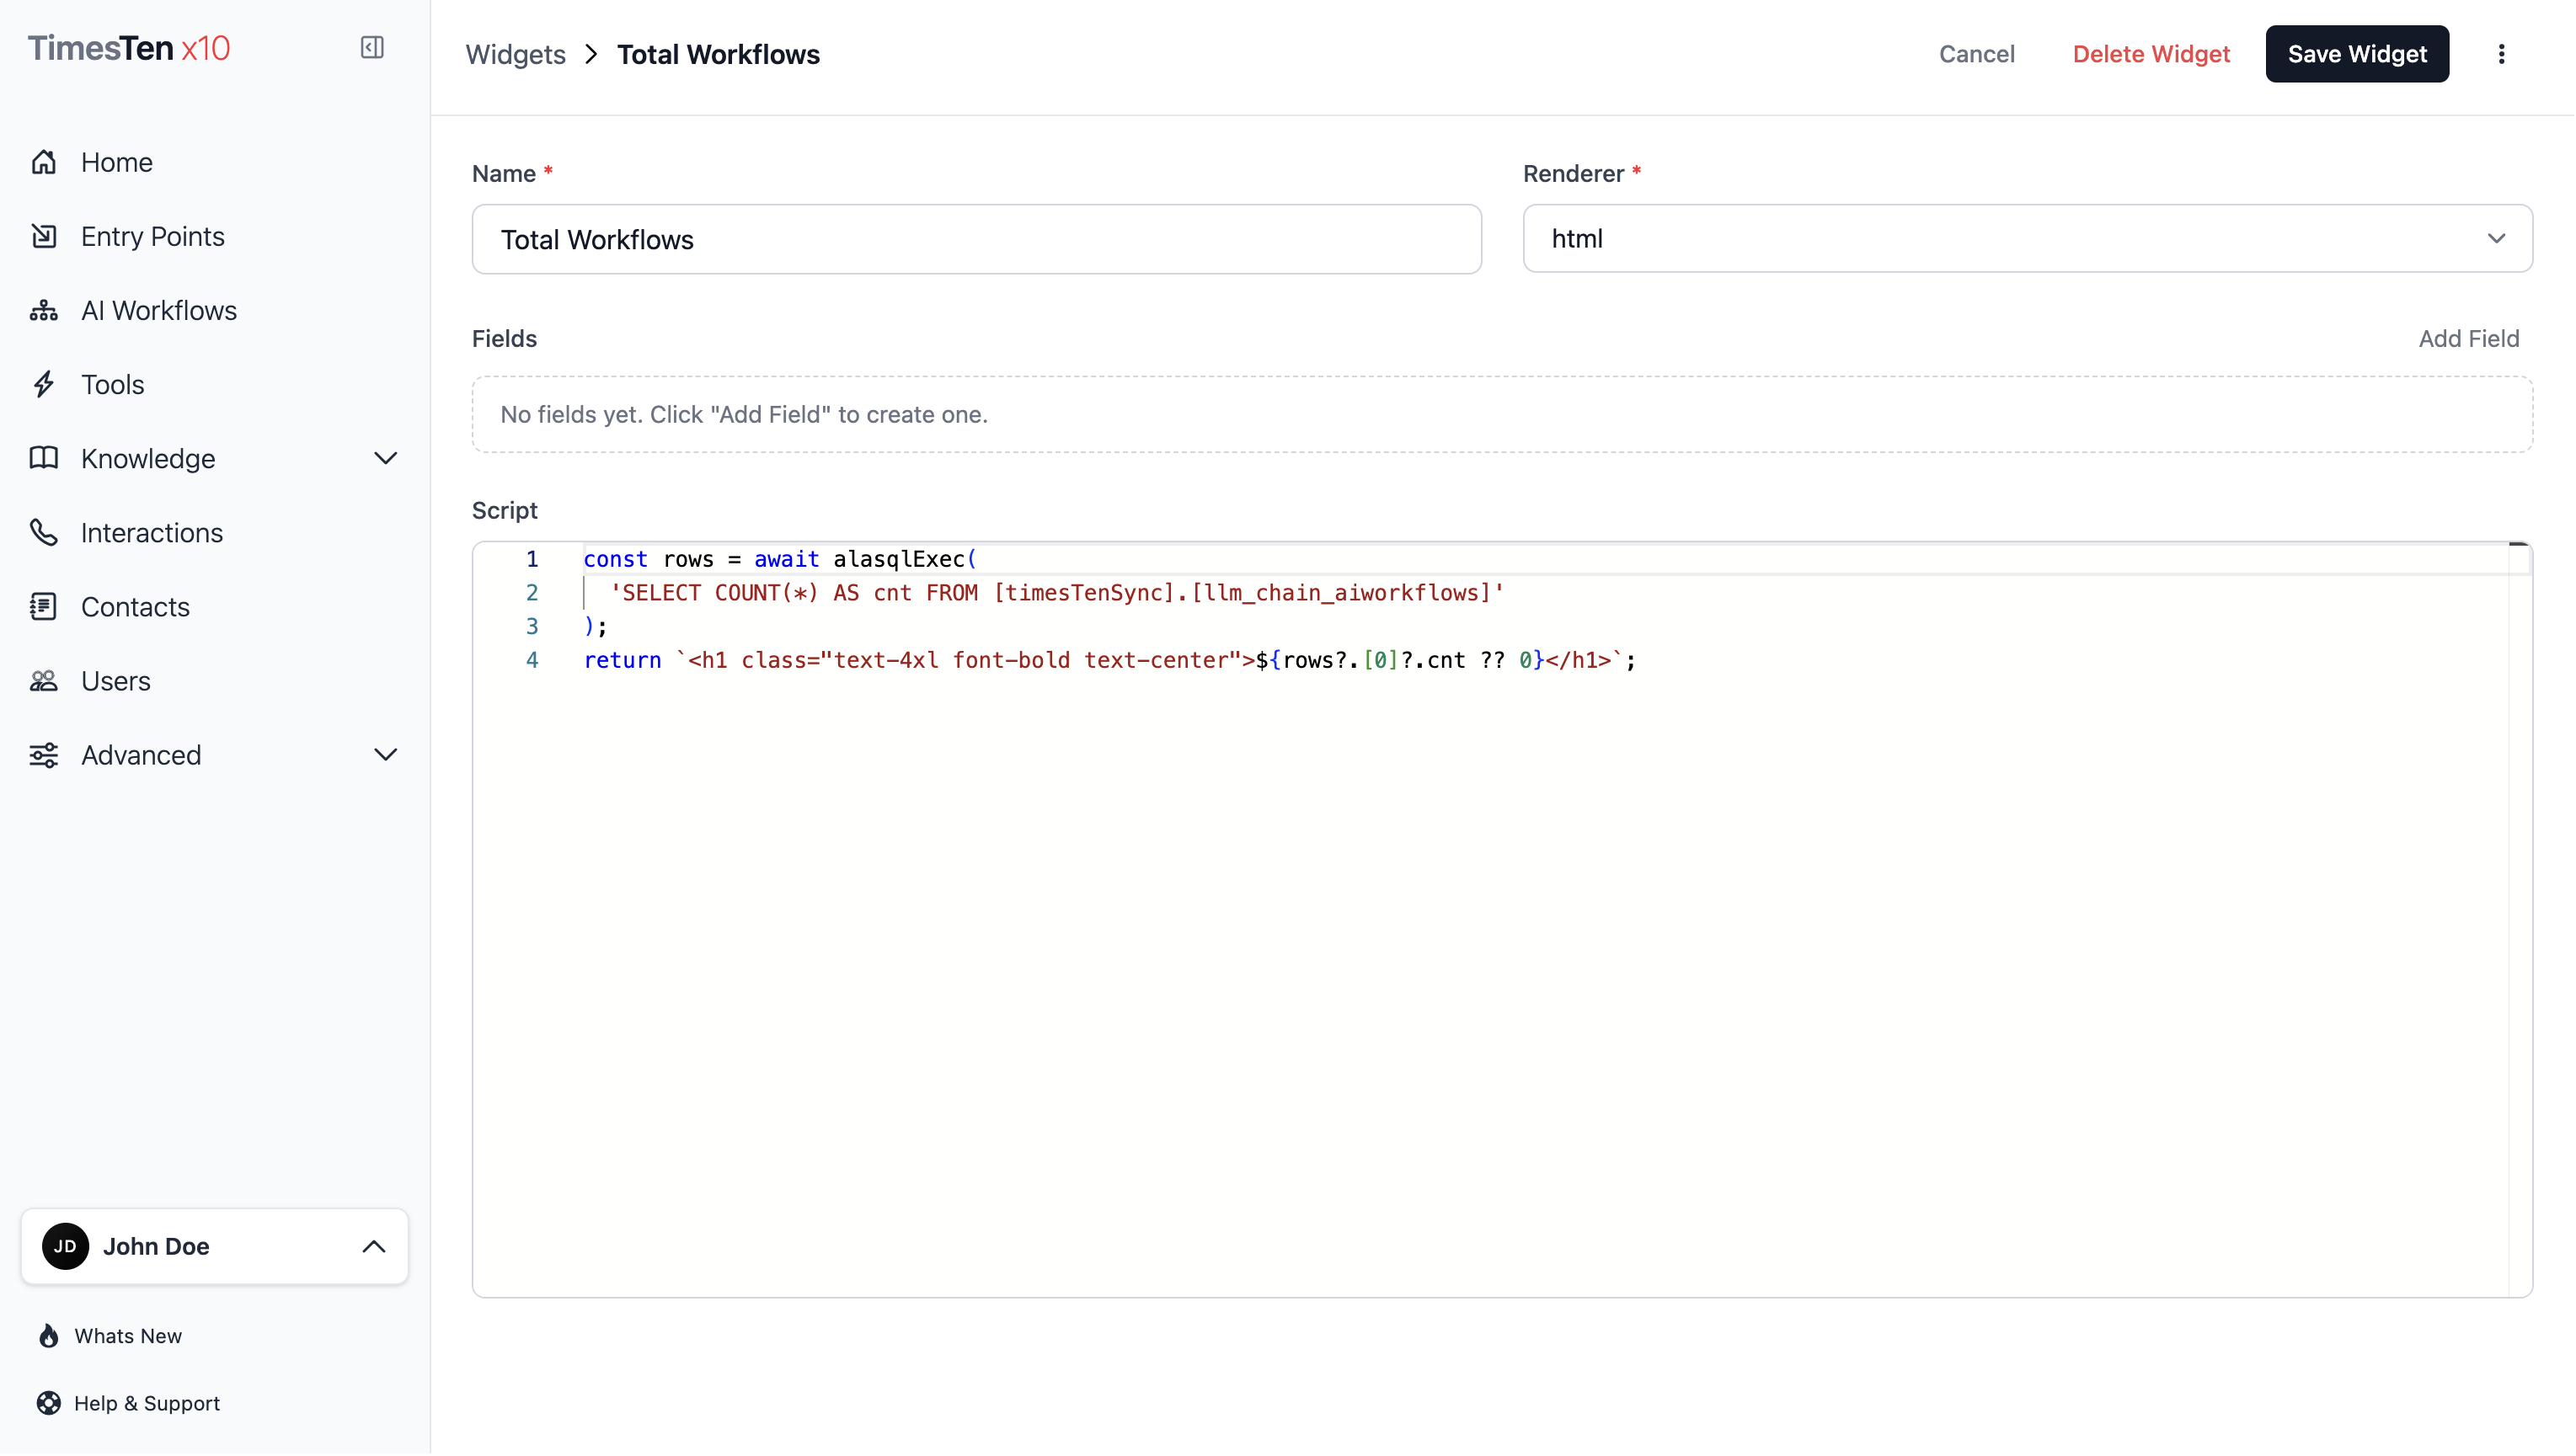
- Click Create Widget.
- Enter a name.
- Select a renderer — HTML, chart, or grid.
- Optionally define fields — named inputs with types (string, number, boolean, date).
- Write a script in the JavaScript editor.
- Click Save Widget.
Write a widget script
Section titled “Write a widget script”The script editor uses Monaco with JavaScript syntax highlighting. Your script has access to a context object that includes dashboard and filter information.
alasql/alasqlExec()for client-side query operations.consolefor logging.datafor render configuration JSON.paramsfor additional input parameters.globals.dashboardIdfor the current dashboard.globals.dashboardFiltersfor the active workflow and date filters from Home.
Return format
Section titled “Return format”Your script must return data in the format matching the renderer:
HTML renderer:
return "<div>Total: 42</div>";// orreturn { type: "html", payload: "<div>Total: 42</div>" };Chart renderer (ECharts):
return { type: "chart", payload: { xAxis: { type: "category", data: ["Mon", "Tue", "Wed"] }, yAxis: { type: "value" }, series: [{ data: [150, 230, 224], type: "line" }], },};Grid renderer:
return { type: "grid", payload: [ { name: "Item 1", value: 100 }, { name: "Item 2", value: 200 }, ],};Scripts have a 10-second execution timeout.
Preview and error handling
Section titled “Preview and error handling”Use preview runs before placing a widget on a production dashboard.
- Rendered preview means the return shape matches the selected renderer.
- Empty state means the script ran but returned no usable rows, HTML, or chart series.
- Script error means JavaScript failed, a query failed, or the return shape was wrong.
- Timeout means the script exceeded the execution limit and should be simplified or narrowed.
Keep widget scripts focused on visualization and light data shaping. Use workflow tools or backend integrations for side effects and long-running operations.
Define widget fields
Section titled “Define widget fields”Fields are input parameters your script can use. Each field has:
- Name for the field identifier.
- Type for the expected value shape.
- Value for the default input.
What to watch out for
Section titled “What to watch out for”- Match the script return shape to the selected renderer.
- Keep widget scripts focused on rendering and light transformation.
- Avoid long-running or side-effect-heavy logic in widget code.
- Use preview runs before publishing dashboards that depend on the widget.
Delete a widget
Section titled “Delete a widget”- Open the widget you want to remove.
- Click Delete Widget.
- Confirm the deletion.
How do I use dashboard filters in my widget script?
Access them via globals.dashboardFilters. This includes workflowId, workflowIds, from, to, timezone, and preset.
Can I query the Octo API from a widget script?
Use alasqlExec() for client-side data queries. For server-side API calls, use the render configuration to pass data into the widget.
Related pages
Section titled “Related pages”- Dashboards — arrange widgets into layouts
- Developer Storage and Scoping — understand dashboard and widget data scope